
Introduction
Human health responds to changes in biodiversity in complex and sometimes opposite ways (Robinson et al., 2024). On one hand, biodiversity supplies food, shelter, and medicine that are vital to human health (Diaz et al., 2018). Ecosystem services, such as climate stabilization, air and water filtration, and natural hazards mitigation, support human societies by maintaining safe and adequate environmental conditions (Jackson et al., 2013). On the other hand, infectious diseases originating in wildlife are a serious threat to public health, the transmission of pathogens from animals to humans being a major cause of disease outbreaks (K. E. Jones et al., 2008). Plant diseases also impact human health by hindering ecosystem services, e.g. through food contamination or the reduction in food production (Al-Sadi, 2017). Biodiversity and human health can both be affected by the same threats (Carlson et al., 2025), supported by the same strategies that mitigate these threats (Kilpatrick et al., 2017), and monitored by the same set of tools (Poisot et al., 2025), which further underscores their interconnections.
The One Health approach (OHHLEP et al., 2022; Winkler et al., 2025) acknowledges the interconnections between human, animal, plant, and environmental health (Rabinowitz & Conti, 2013) by fostering collaboration between health professionals, veterinarians, and biologists to address complex public health challenges. To do so, it engages a socioecological systems perspective that notably recognizes the importance of biodiversity conservation for public health (Winkler et al., 2025). This approach is operationalized through the One Health Joint Plan of Action (OH JPA) (2022-2026), which is an action-oriented framework aimed at advancing One Health principles by 2026 (Quadripartite organizations, 2022). Developed by the Quadripartite organizations, which is a strategic partnership between the Food and Agriculture Organization of the United Nations (FAO), the United Nations Environment Programme (UNEP), the World Organisation for Animal Health (WOAH), and the World Health Organization (WHO), the OH JPA contains 19 actions that countries can take to improve One Health capacity-building, political commitment, governance structure, funding, and knowledge systems. These actions form six tracks that collectively seek to strengthen health systems (track 1) and food safety capacities (track 4) while preventing zoonotic diseases (tracks 2 and 3), antimicrobial resistance (track 5), and environmental degradation (track 6). However, there are currently no indicators for monitoring the implementation of this plan. As we enter the final year of the plan, the need to evaluate the progress made since its adoption in 2022 grows acute for at least two reasons: to encourage States to effectively implement policies for the OH JPA as it is a statement of intent with no legal or binding force, and because this evaluation is essential to inform the development of the next version of the plan.
A solid example of monitoring can be found in the Kunming-Montreal Global Biodiversity Framework (KM-GBF) (UNEP, 2022a), adopted in 2022 by the Parties to the Convention on Biological Diversity (CBD). The KM-GBF aims to halt and reverse biodiversity loss by 2030 through 4 general goals and 23 specific targets, ranging from the restoration of degraded ecosystems to the integration of biodiversity in decision-making. For the first time since the CBD was signed in 1992, the KM-GBF includes a monitoring framework (UNEP, 2025) made up of 204 indicators that countries can use to monitor these goals and targets. These indicators are classified in four groups: headline (high-level), binary (yes/no questions), component (technical), and complementary (supporting) indicators. Only two of these groups (headline and binary indicators) are mandatory when reporting national progress to the CBD. This reliance on policy evaluation and indicators is in line with a broader trend that some refer to as an “indicator industry” (Lehtonen, 2015), which aims to provide more precise and quantitative assessments of policies.
Biodiversity indicators are defined as measures of changes in the state of biodiversity over time that allow for tracking progress towards specific objectives (Hébert et al., 2025; J. P. G. Jones et al., 2011). As such, they are intended to serve several purposes, the main ones being to simplify complex phenomena which are difficult to measure directly, and to improve accountability and effectiveness through prioritization, evaluation and communication of objectives and policies (Amuasi & Winkler, 2025; Gudmundsson, 2003; Nicholson et al., 2012). The CBD serves as a good example of how such indicators constitute “soft instruments” capable of incentivizing States to act when the international agreement is not legally binding (Kirsop-Taylor, 2022).
More recently, the Parties to the CBD also adopted the Global Action Plan on Biodiversity and Health (GAP-BH), which formally recognizes the links between the two (UNEP, 2024). The GAP-BH groups the targets of the KM-GBF into 14 thematic categories, encompassing a variety of topics ranging from “Land and sea use” (category 1) to “Knowledge and engagement of people” (category 14). Each thematic category has its own relevance to human health. For example, the targets that fall under the “Land and sea use” category, which include the “restoration of 30% of all degraded ecosystems” (target 2) and the “conservation of 30% of land, waters and seas” (target 3), contribute to “the continued provision of nature’s contributions to people, which in turn support health and reduce disease emergence and transmission among wildlife, livestock and people.” (UNEP, 2024). Because of the high relevance of all KM-GBF targets to human health as described in UNEP (2024), we hypothesized that a large proportion of the indicators of these targets would also be relevant to health, and therefore to the retroactive monitoring of the OH JPA. Given the recent increase in prominence of the One Health concept following its introduction in the Article 5 of the WHO Pandemic Agreement (WHO, 2025), it is also crucial to anticipate on the reporting need of a future high-level document for One Health, and to suggest existing indicators and reporting processes that can support its implementation.
We argue that reusing some of the same indicators for both monitoring systems (the KM-GBF and the OH JPA) would improve their efficiency and reduce the workload of countries, as developing and measuring indicators require significant resources and expertise from all governments, which should therefore be allocated wisely. This is illustrated by the reluctance which was voiced during the vote of the KM-GBF monitoring framework, where “many delegates were concerned that a large number of targets and indicators increased challenges for communication and monitoring, especially by less well-resourced nations” (Carroll et al., 2024). This highlights the need to make existing indicators more efficient by making them serve more than one purpose. Moreover, it is worth noting that, in the absence of a prior monitoring system, many of the KM-GBF indicators still lack an agreed-upon methodology, both at the national and international levels (Affinito et al., 2025): a further reason why pooling efforts would help improve both this framework and the OH JPA. Despite these difficulties, the indicators of the KM-GBF have ultimately achieved a broad global consensus, and this grants them an important legitimacy as reporting instruments in other context, whenever they are relevant.
This study therefore aimed to identify the indicators of the KM-GBF monitoring framework that are of relevance to health. First, we assessed the link between each of these indicators and human, animal, plant, and environmental health, respectively. Then, we evaluated the usability of the indicators for monitoring the specific action tracks of the OH JPA. We show how biodiversity monitoring can become an essential component of effective One Health strategies, and how it can be used to track the progress made towards the ambitious goals of the OH JPA.
Methods
We qualitatively assessed the relevance of all 204 KM-GBF indicators (UNEP, 2025) to health. This was done independently by at least two evaluators for each of the indicators, this process leading to a consensus among the coauthors for all indicators. Specifically, we evaluated the degree to which the indicators are linked to each of the four pillars of One Health (i.e., to human, animal, plant, and environmental heath), as well as their usability for monitoring the OH JPA. Our assessments were informed by the metadata (rationale, definition, method of computation, data sources, and scale of use) of the indicators provided by the World Conservation Monitoring Centre of the UN Environment Programme (UNEP-WCMC, 2025), when available, looking for explicit considerations of health. When such metadata was unavailable, assessments were supplemented by expert elicitation. The result of this analysis and the code to reproduce the figures are available on Zenodo (https://doi.org/10.5281/zenodo.20085701).
Assessing the link between KM-GBF indicators and health
We classified the degree to which the KM-GBF indicators are linked to each of the four pillars of One Health into four categories: direct connection, indirect connection, potential connection, and no connection. An indicator was classified as directly connected to health when there is a direct causal relationship between the indicator and health. This is the case, for instance, when the indicator directly measures a condition or determinant of health. In contrast, an indicator was classified as indirectly connected to health when there is an intermediary factor between the indicator and health, and as potentially connected when there are multiple intermediary factors or when its connection to health is likely but difficult to certify. Finally, an indicator was classified as not connected to health when the connection is unlikely, unsupported by current scientific evidence, or absent. For each of the four pillars of One Health, we counted the number of indicators assigned to each category.
For example, headline indicator 7.2 “Pesticide environment concentration and/or aggregated total applied toxicity” was considered directly connected to human health because of the toxicity of many pesticides under high level of exposure (Kim et al., 2017). It was also considered directly connected to animal, plant, and environmental health because the use of pesticides can benefit the growth of cultivated plants through the reduction of herbivory and competition, while being highly harmful to animals and biodiversity (Mahmood et al., 2016). In contrast, component indicator 4.CT.1 “Number of plant and animal genetic resources for food and agriculture secured in either medium- or long-term conservation facilities” was considered indirectly connected to human health because conserving genetic resources increases the resilience of food systems to global disasters (Esquinas-Alcázar, 2005), which in turn protects human health. However, we did not find any evidence of a link between this indicator and animal, plant, or environmental health.
Assessing the usability of KM-GBF indicators for monitoring One Health action tracks
For each action track of the OH JPA, we classified the KM-GBF indicators into three categories: directly usable, usable after adaptation, and not usable. Directly usable indicators can be used in their current form to monitor the implementation of at least one action in an action track. They can detect trends relevant to the actions of the track and do not require adaptations. For example, we qualified headline indicator 7.2 “Pesticide environment concentration and/or aggregated total applied toxicity” as being directly usable for monitoring the sixth action track because it is a direct measure of environmental degradation and contamination. In contrast, indicators usable after adaptation need to be slightly modified before being used to monitor actions in an action track. These adaptations should be small changes in the scale of measurement, the data resolution, or the taxa monitored by the indicator. For instance, headline indicator 7.2 was qualified as being usable after adaptation for monitoring the fourth action track on food safety risks. To be more relevant for this action track, this indicator could refer more specifically to the use of pesticides in agriculture. Finally, not usable indicators are outside the scope of an action track or need to be greatly modified before being used to monitor the implementation of an action track.
We assessed usability for each action track independently, i.e. an indicator can be useful for monitoring multiple action tracks. For each action track, we counted the total number of indicators in each category. We also counted the number of usable indicators for the whole plan regardless of the action tracks. Then, we partitioned these numbers based on the group of indicators in the KM-GBF monitoring framework (i.e. headline, binary, component, and complementary indicators) and the thematic categories of the GAP-BH. Finally, for each action track where an indicator was considered usable (either directly or after adaptation), we identified the most relevant action that can be monitored by the indicator, and counted the number of indicators associated with each action.
Results and discussion
Link between KM-GBF indicators and health
We found that 75% of KM-GBF indicators are either directly or indirectly connected to either human, animal, plant, or environmental health, with approximately 55% of indicators being directly connected to health. This signifies that monitoring the state, benefits, and pressure of biodiversity and our responses to biodiversity loss provides extensive health information. In Figure 1, we show the number of indicators that are directly, indirectly, potentially, and not connected to each of the four pillars of One Health. The number of directly connected indicators is, as expected, slightly higher for environmental health (41% of indicators) compared to human (27%), animal (26%), and plant (28%) health, mostly because the environment trivially contains most of biodiversity. However, this difference is less pronounced after adding indirectly connected indicators (63% for environmental health compared to 56%, 53%, and 51% respectively for human, animal, and plant health), highlighting the multiple pathways through which biodiversity and health are connected.
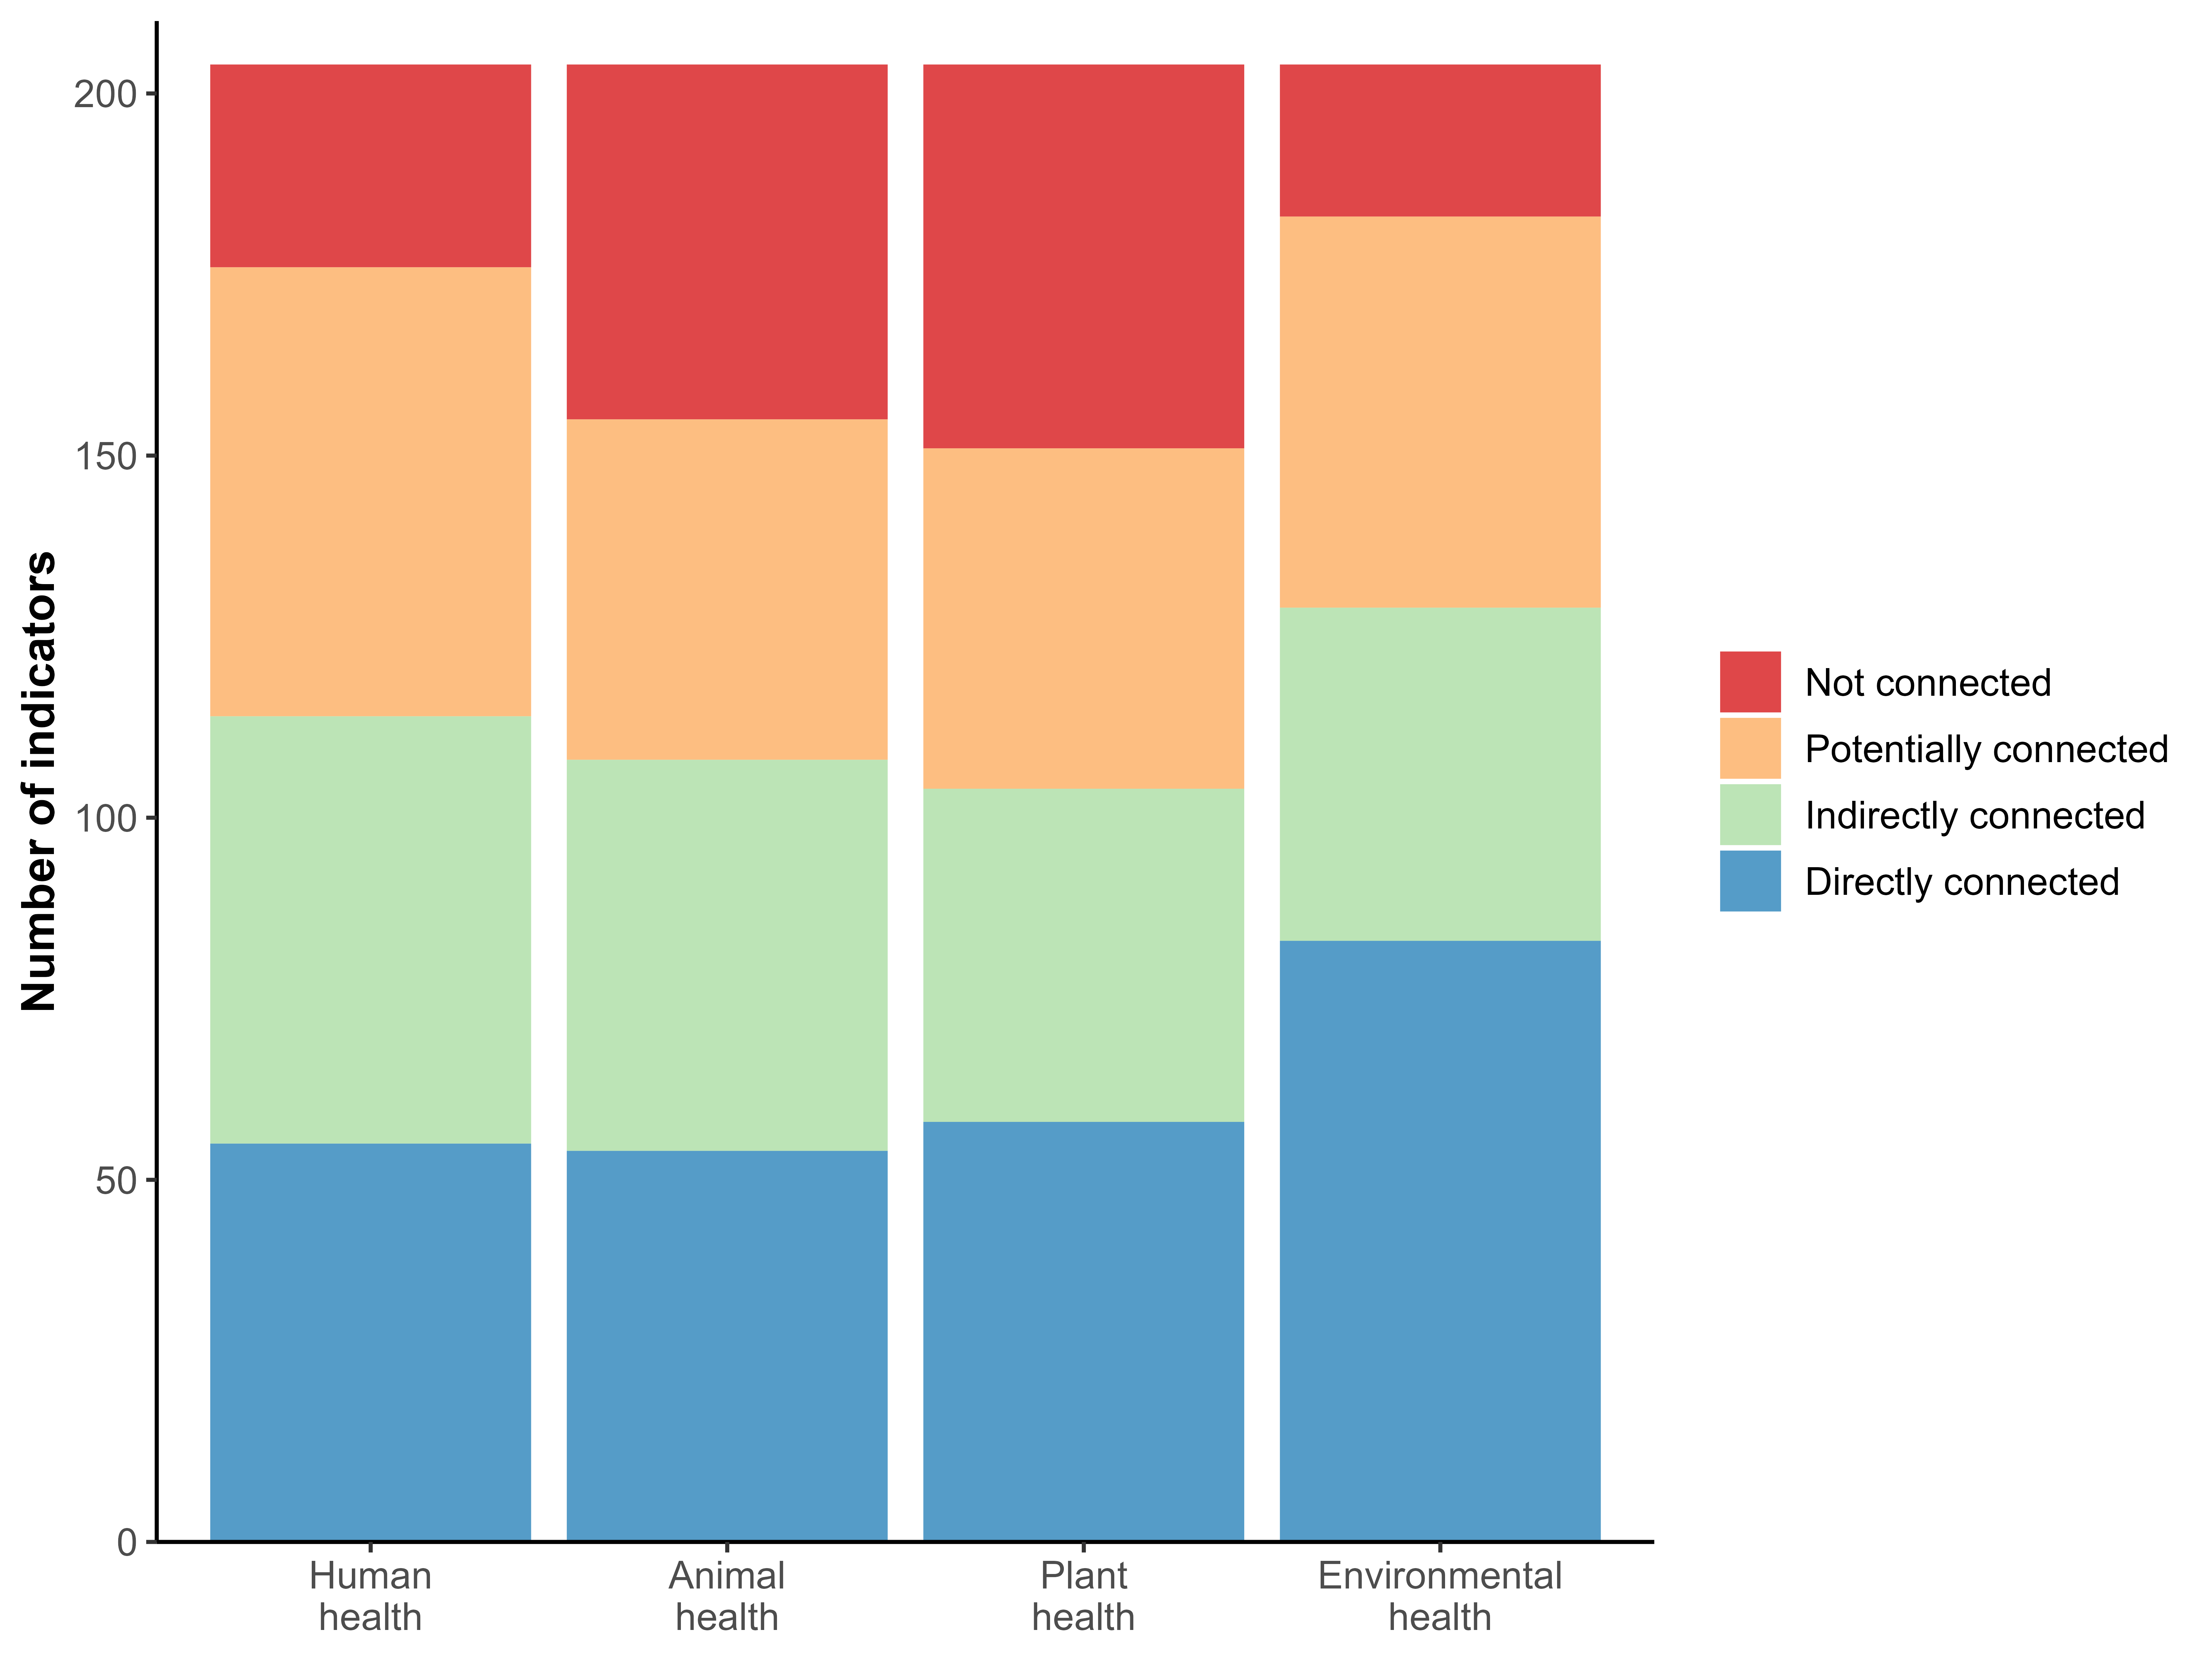
The fact that most KM-GBF indicators are connected to health is not surprising. The GAP-BH recognizes the relevance to health of all 23 targets of the KM-GBF, and because the indicators measure the progress made towards these targets, they also measure the progress made towards a healthier planet. However, we did not expect that comparable numbers of indicators would be linked to the four pillars of One Health, indicating that similar amount of biodiversity information can be reused, either directly or indirectly, to monitor human, animal, plant, and environmental health. This result therefore suggests that the core components of One Health can all be meaningfully informed by biodiversity monitoring.
Usability of KM-GBF indicators for monitoring One Health action tracks
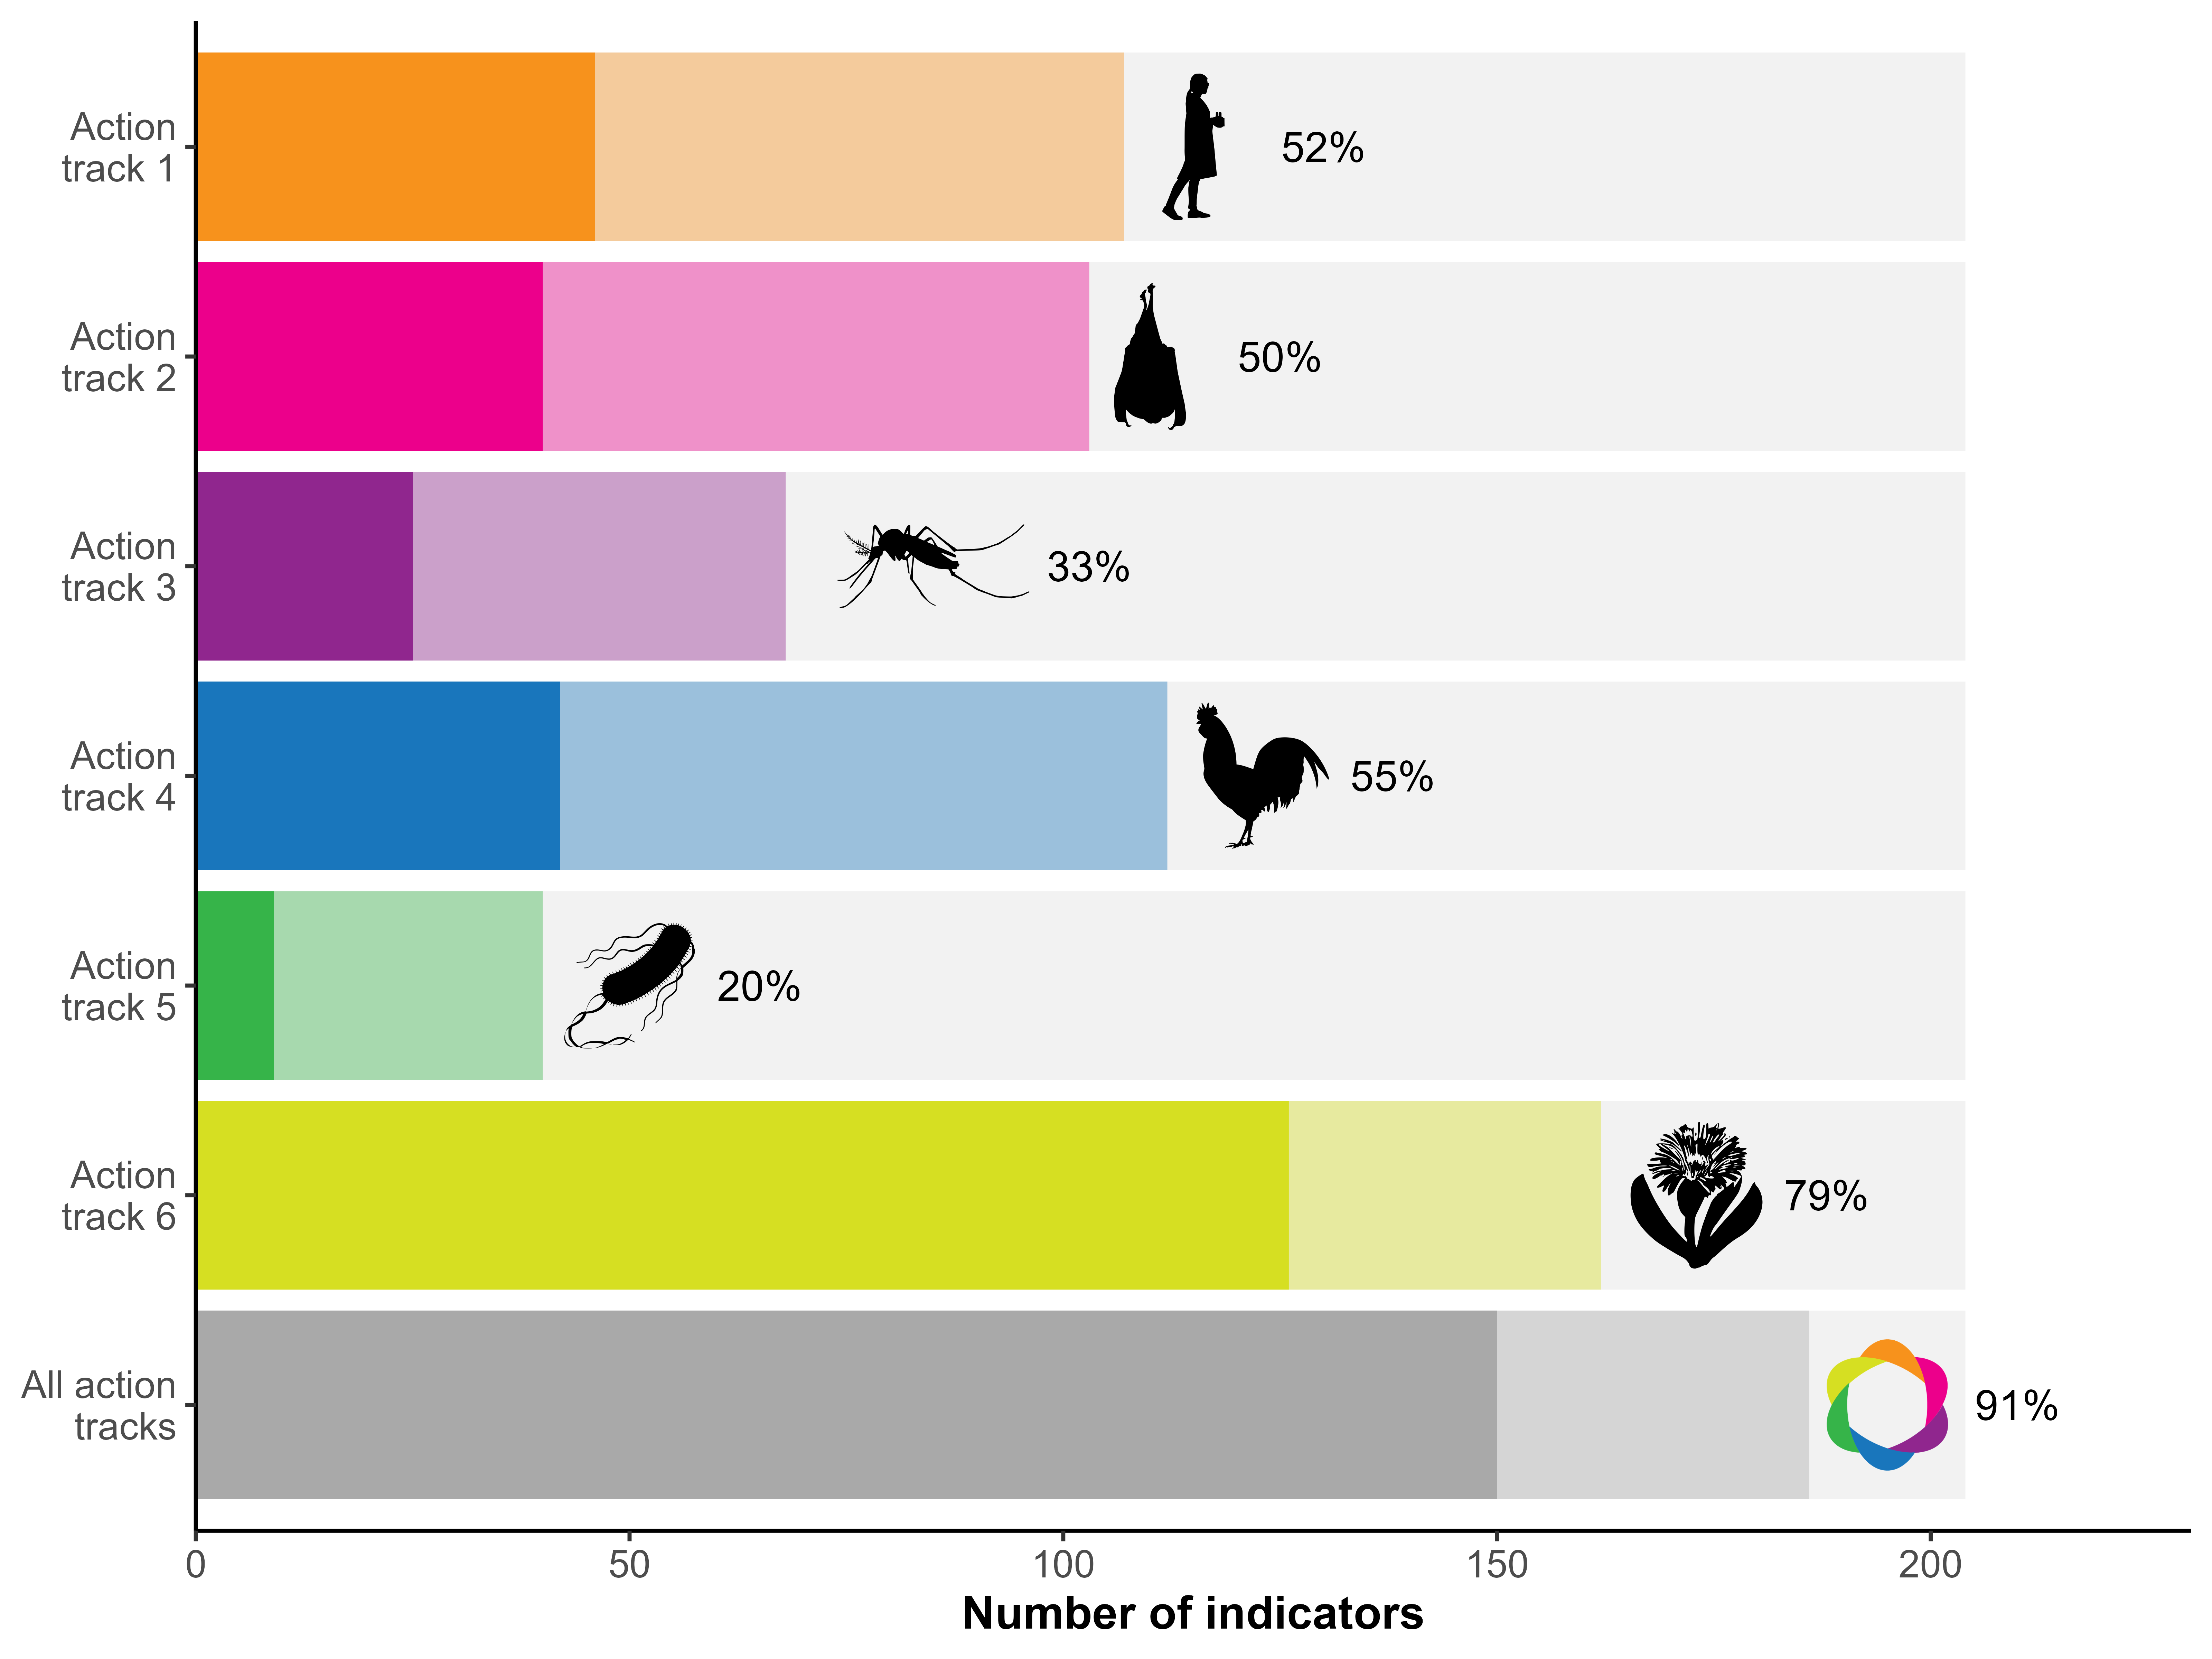
The vast majority of KM-GBF indicators (91%) can be used either directly or after adaptation to monitor the OH JPA action tracks, and around 74% of indicators can be used directly. This signifies that we can already do an extensive evaluation of One Health actions with existing data and methodologies. However, we show in Figure 2 that the usability of indicators greatly differs depending on the action track. The proportion of usable indicators varies from 20% for the fifth action track on antimicrobial resistance (4% of directly usable indicators) to 79% for the sixth action track on the integration of the environment into One Health (62% of directly usable indicators). The high proportion of usable indicators for the sixth action track is not surprising given that the KM-GBF is a multilateral environmental agreement that aims to protect species and restore ecosystems. The low proportion of indicators that can monitor actions in the fifth action track could be due to the characteristics of these actions, which are more focused on collaboration, capacity-building and awareness-raising than the decrease and prevention of antimicrobial resistance through biodiversity. Similarly, the actions in the third action track on endemic zoonotic, neglected tropical, and vector-borne diseases, which can only be monitored by 33% of the indicators, are more centered on capacity-building and less on the drivers and inhibitors of infectious diseases, especially in comparison to the actions of the second action track on zoonotic epidemics and pandemics. These differences suggest that, although the KM-GBF monitoring framework can greatly support One Health agencies by reducing the need to develop, gain expertise in, and monitor new indicators at the intersection of biodiversity and health, additional work is still needed to equally cover all aspects of the plan.
The number of indicators associated with each action in the OH JPA is presented in Table 1. There are high discrepancies in the usability of indicators between actions. The total number of usable indicators (either directly or after adaptation) varies from 1 (action 5.3: Strengthen global AMR governance structures) to 108 (action 6.1: Protect, restore, and prevent the degradation of ecosystems and the wider environment). Within a single action track, the biggest differences are found in the sixth action track, where only 12 indicators were associated to action 6.4 whereas 108 indicators were associated to action 6.1 This result shows that the KM-GBF monitoring framework can provide substantial information for some of the actions, but it also further highlights the need to identify or develop new indicators for specific actions of the plan, even within the action tracks that can be monitored by numerous indicators, such as action track 6.
| Action | Directly usable | Usable after adaptation | Total usable |
|---|---|---|---|
| 1 Enhancing One Health capacities to strengthen health systems | 46 | 61 | 107 |
| 1.1 Establish the foundations for One Health capacities | 30 | 5 | 35 |
| 1.2 Generate mechanisms, tools, and capacities to establish a One Health competent workforce and the frameworks/processes to facilitate One Health work | 8 | 50 | 58 |
| 1.3 Generate an enabling environment for the effective implementation of One Health | 8 | 6 | 14 |
| 2 Reducing the risks from emerging and re-emerging zoonotic epidemics and pandemics | 40 | 63 | 103 |
| 2.1 Understand the drivers of emergence, spillover, and spread of zoonotic pathogens | 16 | 27 | 43 |
| 2.2 Identify and prioritize targeted, evidence-based upstream interventions to prevent the emergence, spillover, and spread of zoonotic pathogens | 7 | 6 | 13 |
| 2.3 Strengthen national, regional, and global One Health surveillance, early warning, and response systems | 17 | 30 | 47 |
| 3 Controlling and eliminating endemic zoonotic, neglected tropical and vector-borne diseases | 25 | 43 | 68 |
| 3.1 Enable countries to develop and implement community-centric and risk-based solutions to endemic zoonotic, neglected tropical, and vector-borne disease control using a One Health approach involving all relevant stakeholders | 3 | 14 | 17 |
| 3.2 Ensure the harmonized application of One Health principles at all levels by implementing practical measures to strengthen local, national, regional, and global policy frameworks for the control and prevention of endemic zoonotic, neglected tropical, and vector-borne diseases | 18 | 10 | 28 |
| 3.3 Increase political commitment and investment in the control of endemic zoonotic, neglected tropical, and vector-borne diseases, by advocating for and demonstrating the value of a One Health approach | 4 | 19 | 23 |
| 4 Strengthening the assessment, management and communication of food safety risks | 42 | 70 | 112 |
| 4.1 Strengthen the One Health approach in national food control systems and food safety coordination | 18 | 30 | 48 |
| 4.2 Utilize and improve food systems data and analysis, scientific evidence, and risk assessment in developing policy and making integrated risk management decisions | 15 | 21 | 36 |
| 4.3 Foster the adoption of the One Health approach in national foodborne disease surveillance systems and research for the detection and monitoring of foodborne disease and food contamination | 9 | 19 | 28 |
| 5 Curbing the silent pandemic of antimicrobial resistance (AMR) | 9 | 31 | 40 |
| 5.1 Strengthen the capacity and knowledge of countries to prioritize and implement context-specific collaborative One Health work to control AMR in policy, legislation, and practice | 7 | 17 | 24 |
| 5.2 Reinforce global and regional initiatives and programmes to influence and support One Health responses to AMR | 2 | 13 | 15 |
| 5.3 Strengthen global AMR governance structures | 0 | 1 | 1 |
| 6 Integrating the environment into One Health | 126 | 36 | 162 |
| 6.1 Protect, restore, and prevent the degradation of ecosystems and the wider environment | 92 | 16 | 108 |
| 6.2 Mainstream the health of the environment and ecosystems into the One Health approach | 9 | 7 | 16 |
| 6.3 Integrate environmental knowledge, data, and evidence into One Health decision-making | 20 | 6 | 26 |
| 6.4 Create an interoperable One Health academic and in-service training programme for environmental, medical, agricultural, and veterinary sector professionals | 5 | 7 | 12 |
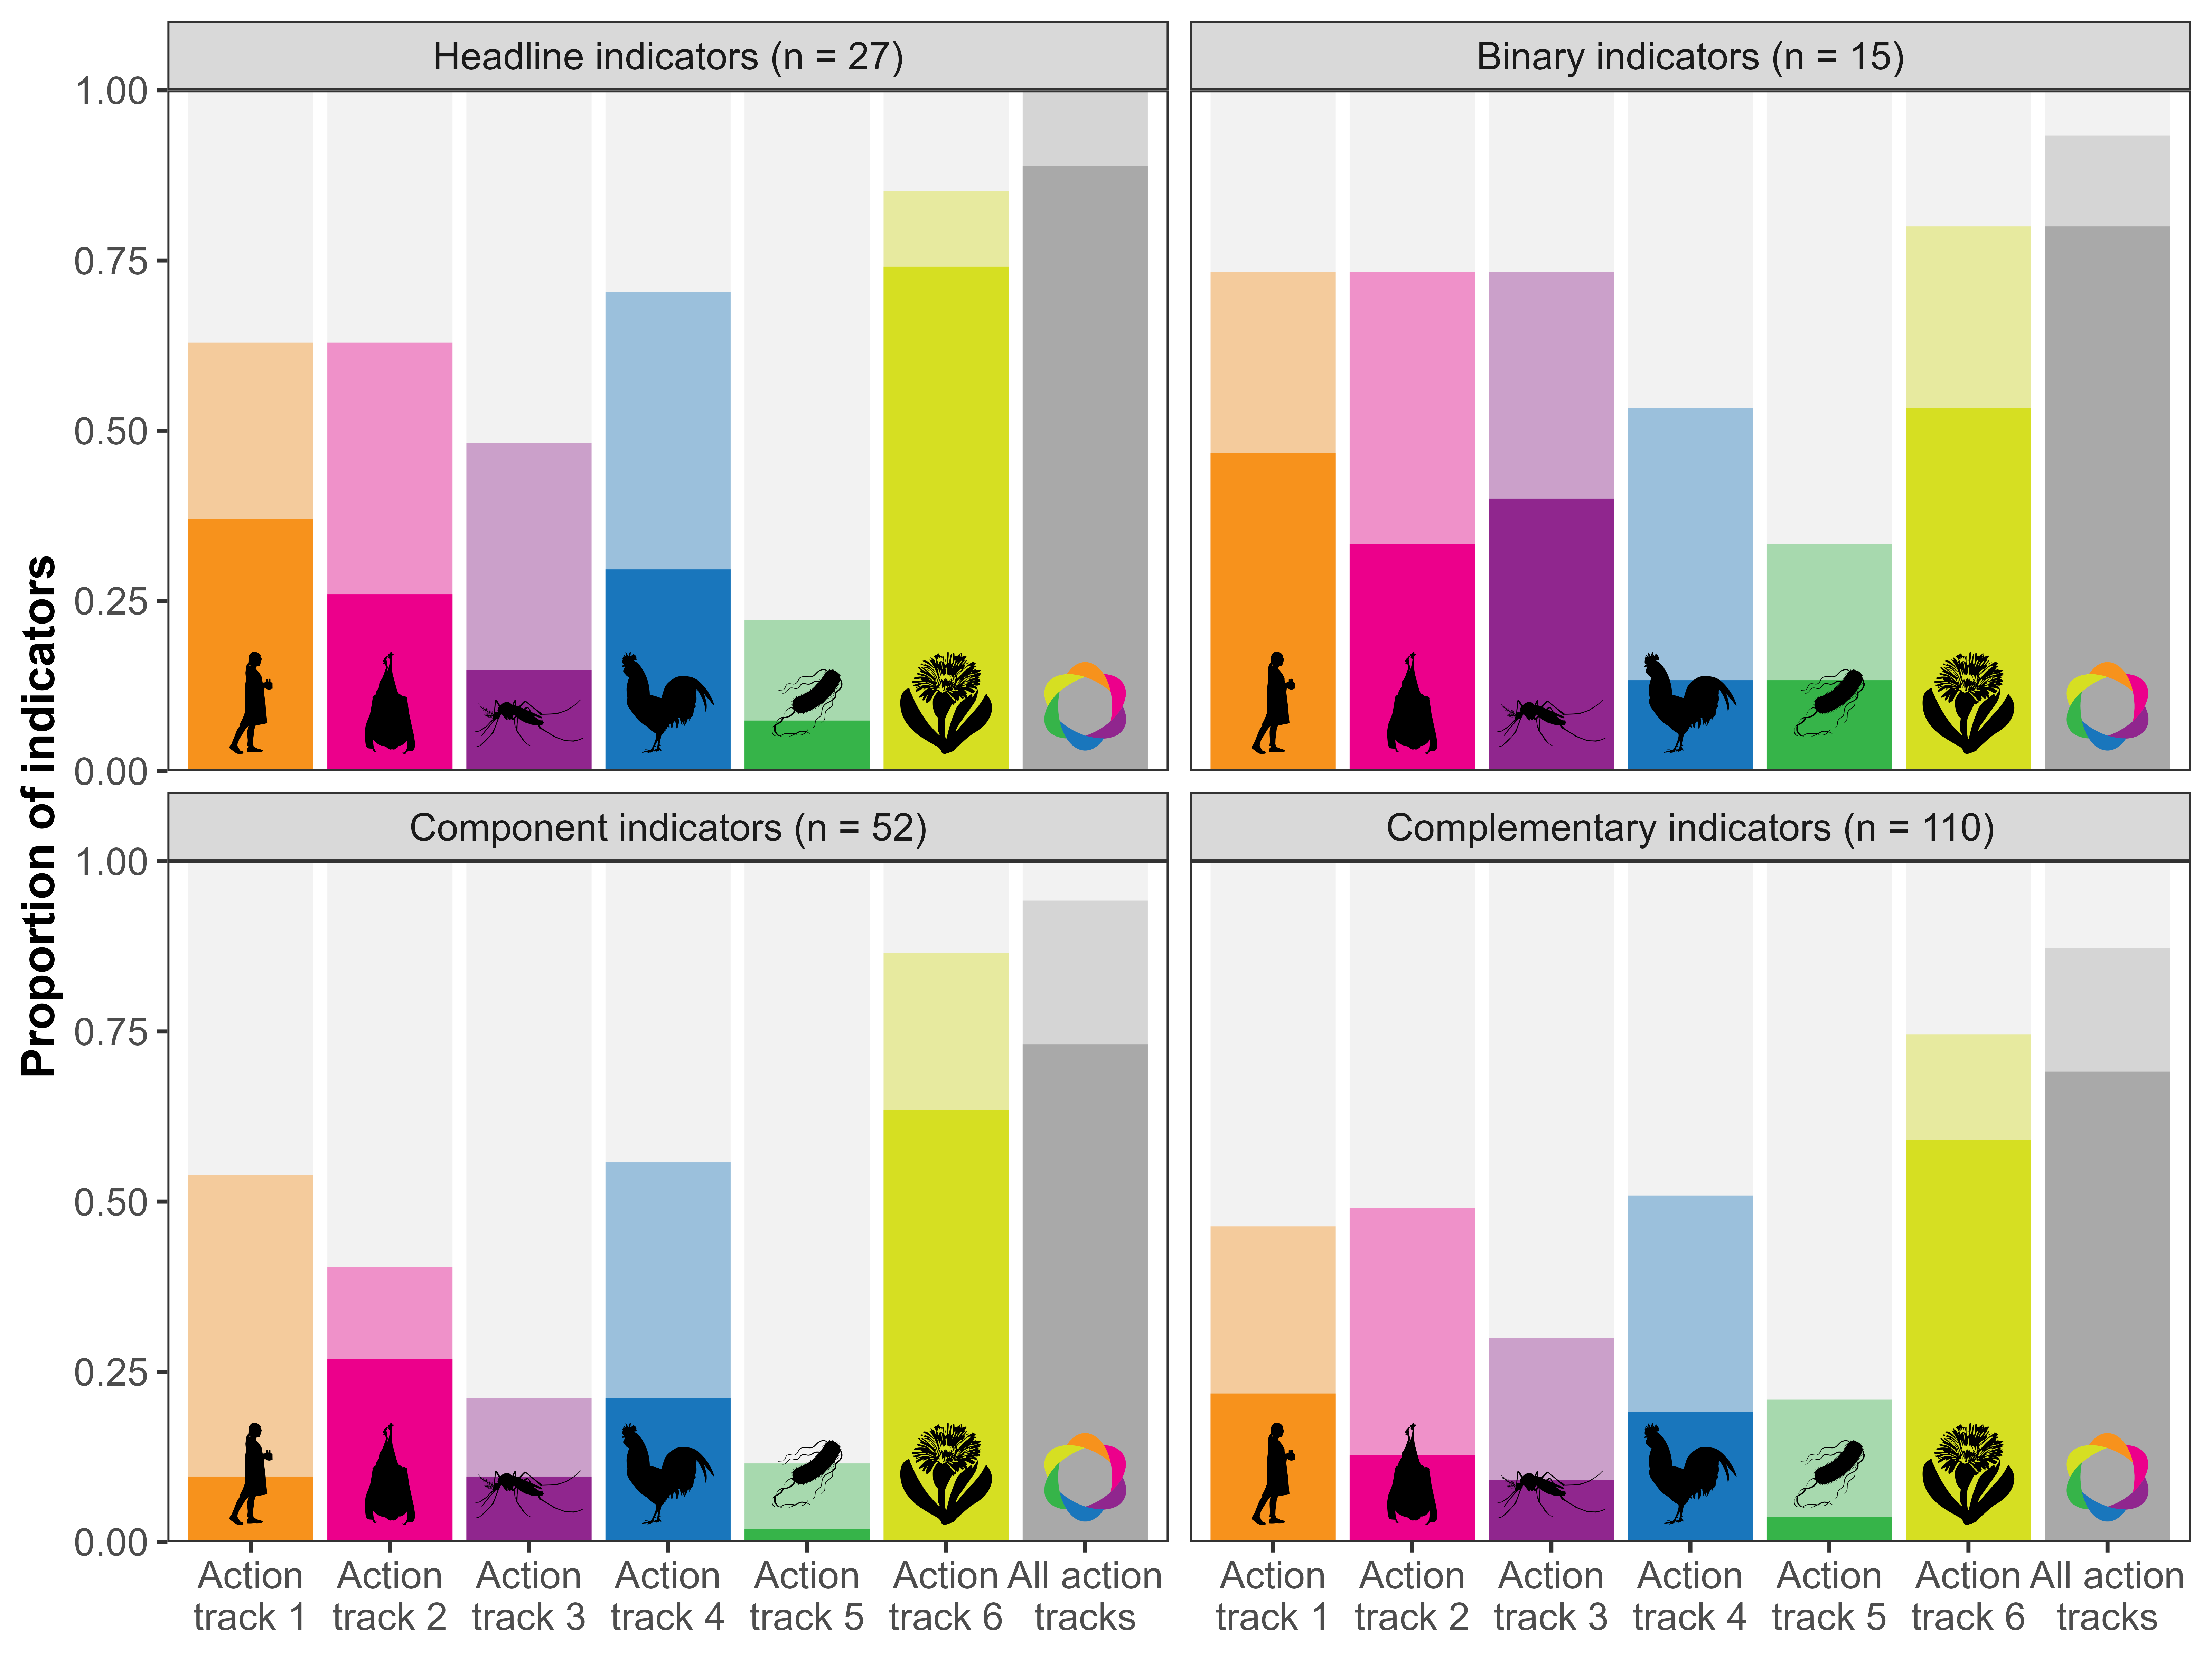
Figure 3 shows the proportion of indicators that can be used to monitor each action track, for each group of indicators in the KM-GBF monitoring framework. We evaluated that 100% of headline indicators (27/27), 93% of binary indicators (14/15), 94% of component indicators (49/52), and 87% of complementary indicators (96/110) can be used, either directly or after adaptation, to monitor at least one action track. Headline and binary indicators are the only two mandatory groups of indicators, i.e. that Parties need to include in their national biodiversity reports. The high proportion of headline and binary indicators is encouraging, because it indicates that the information most likely to figure in national reports will be reusable for evaluating the implementation of the OH JPA. On the other hand, the high reusability of component and complementary indicators, which are currently optional, should be seen as an additional incentive to measure them.
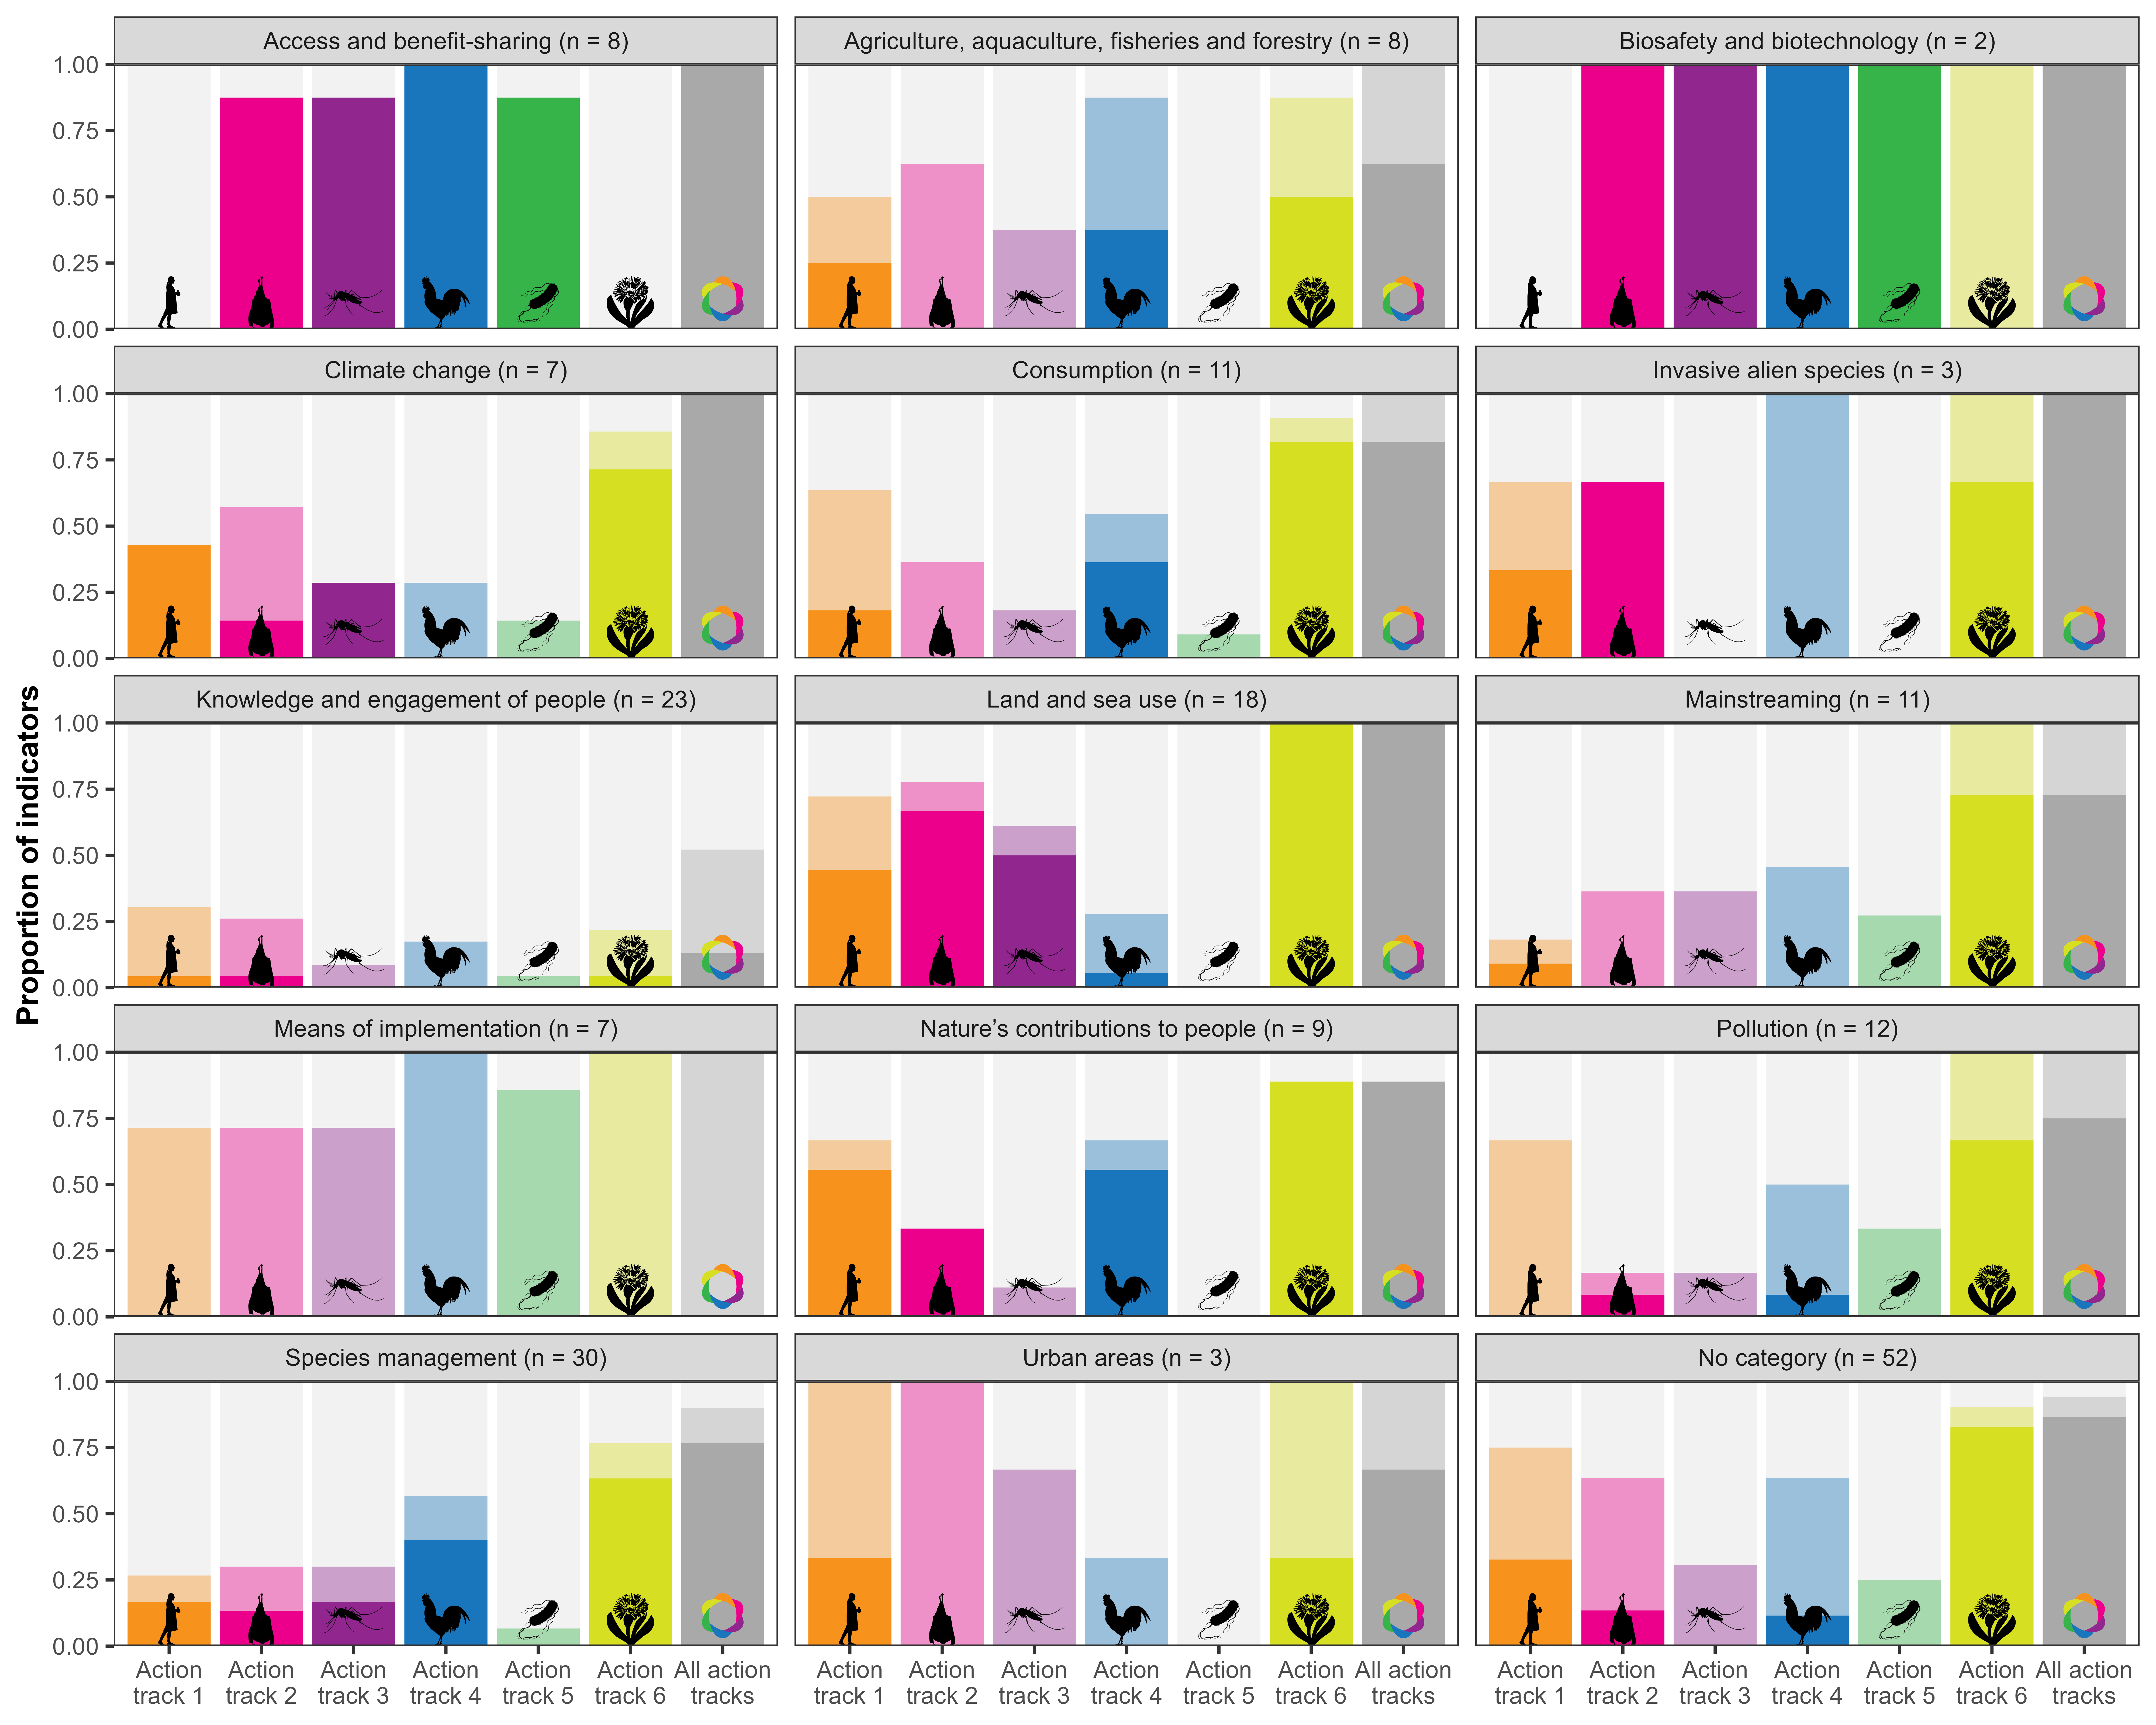
In Figure 4, we present the usability of indicators for each thematic category of the GAP-BH. In every category, at least 89% of indicators can be used, either directly or after adaptation, for monitoring at least one action track, except in the “Knowledge and engagement of people” category, which only has 52% of usable indicators. This suggests that every sector of the KM-GBF monitoring framework, from “Nature’s contribution to people” to “Species management”, is relevant for One Health, even though there are wide variations in the action track most relevant for each category. For instance, the three indicators under “Urban areas” can only be used after adaptation to monitor the action tracks, apart from tracks 1 and 6, yet they do not capture actions related to antimicrobial resistance (track 5). This figure also shows that all indicators that can directly monitor the fifth action track on antimicrobial resistance are in the “Access and benefit-sharing” and “Biosafety and biotechnology” categories, further emphasizing the importance of collaboration, capacity-building and awareness-raising set forth in this action track.
Conclusion
Reusing existing indicators can greatly reduce the workload of countries that are part of different multilateral environmental agreements with overlapping objectives. Instead of developing and measuring new indicators, which can be resource-intensive, reusing indicators from the KM-GBF monitoring framework to monitor the implementation of the OH JPA can increase the efficiency of both monitoring systems. The environmental sector can meaningfully contribute to One Health efforts by sharing their data, tools, and expertise with national One Health agencies, which can in turn provide further incentives and means to measure relevant indicators and improve their methodologies. Making indicators serve more than one purpose can also improve the efficiency of public and private spending by avoiding duplication of work. However, additional effort is needed to identify or develop new indicators to monitor the action tracks where few KM-GBF indicators were found to be usable. These gaps could be filled by finding existing indicators in other multilateral environmental agreements, such as the global indicator framework of the Sustainable Development Goals (SDGs). Nevertheless, the high reusability of most KM-GBF indicators can greatly facilitate the monitoring of One Health action tracks, and putting in the work to monitor the implementation of the OH JPA will be an essential step to ensure it is effectively put into action and meets its goals. As Parties to the CBD submit their National Biodiversity Strategies and Action Plans (NBSAPs) with the monitored indicators (UNEP, 2022b), large amounts of data will become available for the retrospsective assessment of the progress made on the ambitious One Health actions.
Acknowledgments
We acknowledge that this study was conducted on land within the traditional unceded territory of the Saint Lawrence Iroquoian, Anishinabewaki, Mohawk, Huron-Wendat and Omàmiwininiwak nations. TP was funded through award no. 223764/Z/21/Z from the Wellcome Trust and supported by the US National Science Foundation (grant no. DBI 2515340). This manuscript is a contribution of the GEO BON One Health working group.